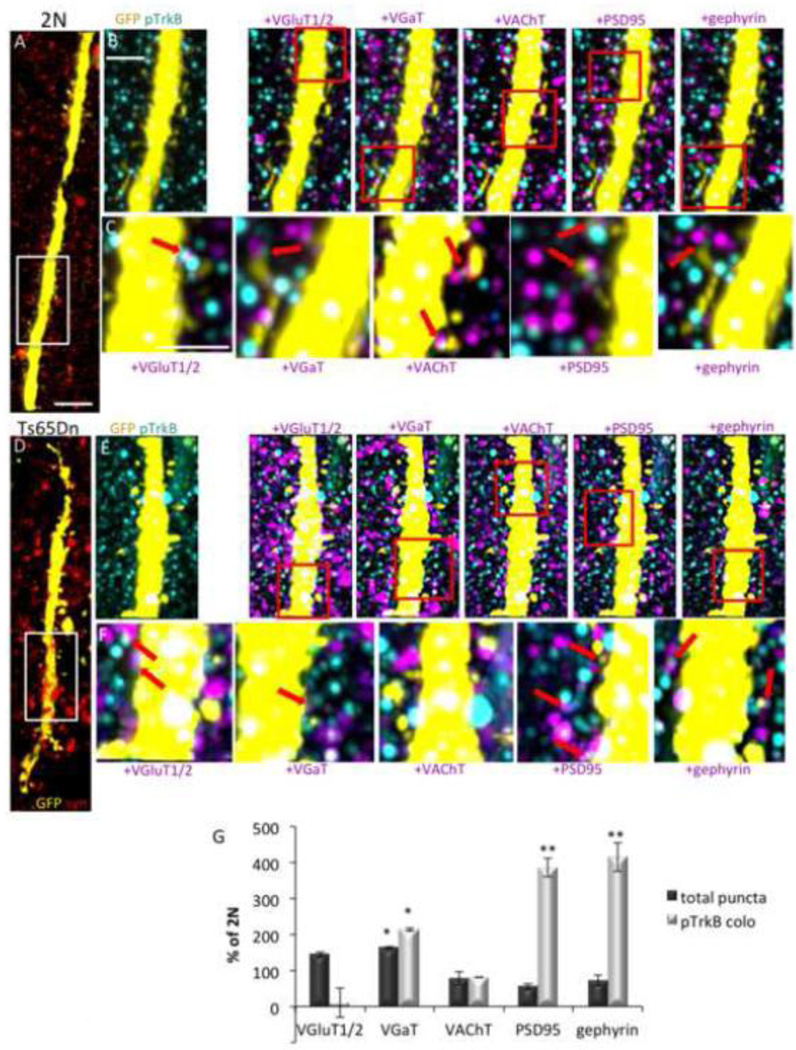
Figure 5. Analysis of pTrkB colocalization with synaptic markers.
(A–F) Representative volume renderings of cortical arrays from a 2N (A–C) and Ts65Dn (D–F) mouse. A and D shows all synapses (synapsin-1, red) surrounding a GFP positive apical dendrite (yellow). Bar = 4 µm. B and E are higher magnification renderings of the area indicated by the white rectangles in A and D, showing colocalization of pTrkB (cyan) with the synaptic markers VGluT1/2, VGaT, VAChT, PSD95, and gephyrin (magenta) on synaptic boutons of a GFP positive dendrite (yellow) of a layer 5 pyramidal cell. White spots on the dendrite indicate areas of overlap between GFP and a single antigen (pTrkB or the indicated synaptic marker). Bar = 2 µm. C and F are higher magnifications of the area indicated by the red rectangles in B and E. Red arrows point to examples of pTrkB colocalized with the indicated synaptic marker on GFP+ dendrites. Bar = 1 µm. (G) Quantification of the total number of synaptic puncta (dark bars) and their normalized colocalization with pTrkB (light bars) in 2N and Ts65Dn mice. Data are expressed as mean ± SEM percent of 2N values. n = 3 per genotype; *p<0.05, **p<0.005 versus 2N.

