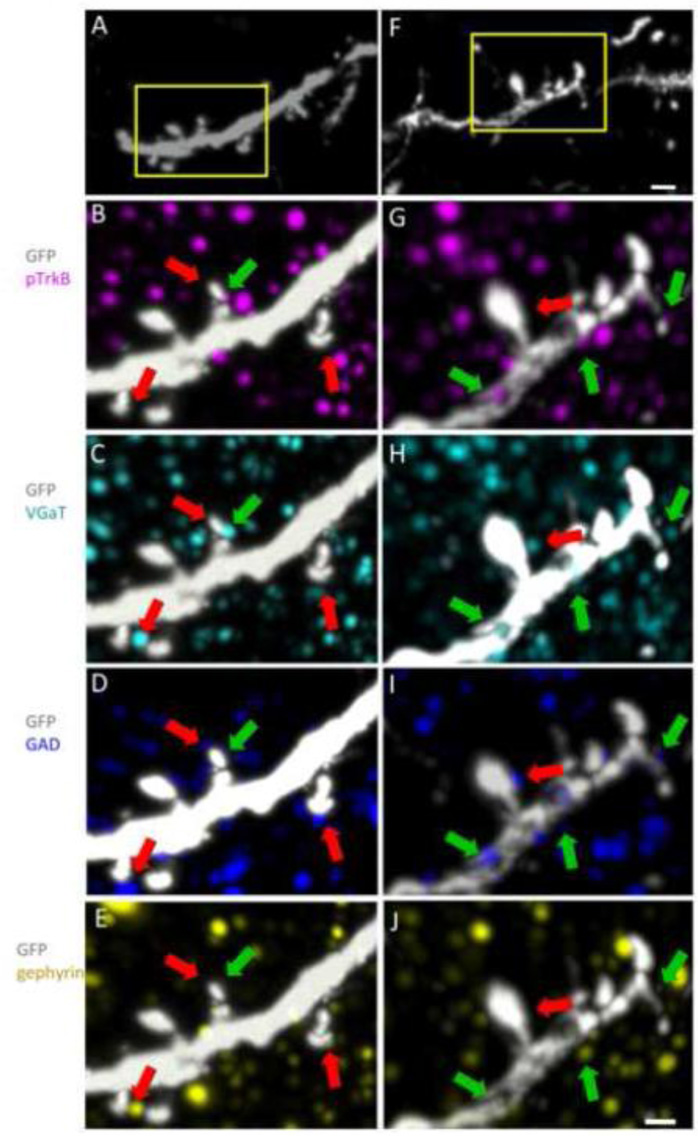
Figure 6. pTrkB in GABAergic synapses.
(A and F) Volume renderings of a GFP (white) positive dendrite of a layer 5 pyramidal neuron from 2N (A) and Ts65Dn (F) cortex. Bar = 2 µm. (B–J) Higher magnification volume renderings of the areas indicated by the yellow rectangles in A and F show colocalization of pTrkB (magenta) with markers of GABAergic synapses in 2N (B–E) and Ts65Dn (G–J) cortical arrays. Green arrows point to examples of pTrkB positive GABAergic synapses. Red arrows point pTrkB negative GABAergic synapses. Bar = 1 µm.

