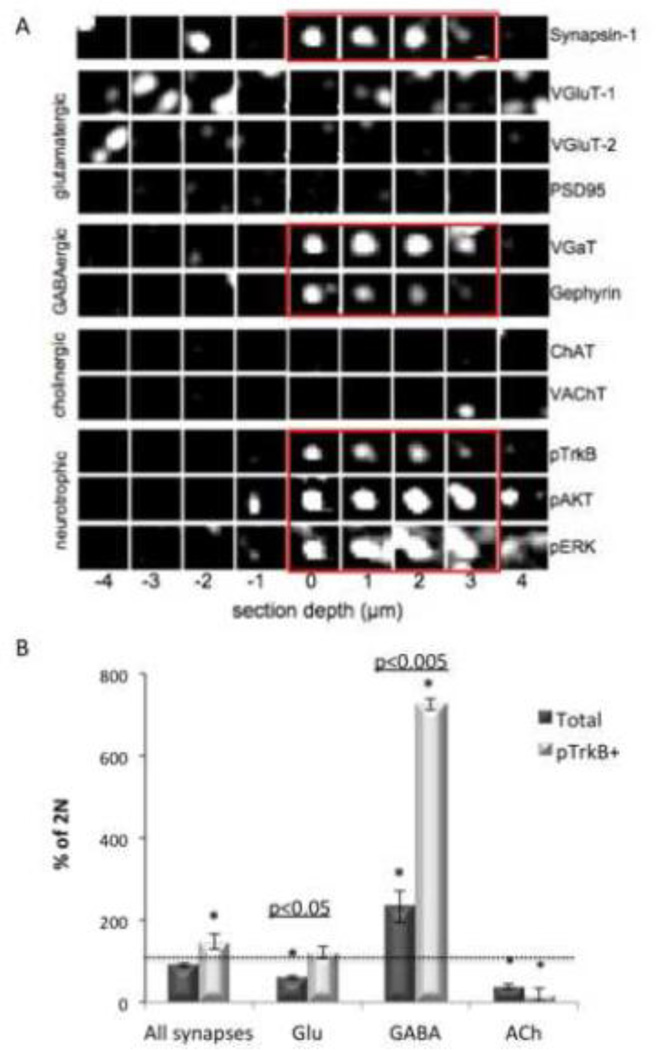
Figure 7. Classification of 2N and Ts65Dn cortical synapses.
(A) A synaptogram generated from sequential staining and elution of the same ribbon of serial cortical sections from Ts65Dn somatosensory cortex layer 4. Columns represent one of nine serial sections, with section ‘0’ located on the center of mass of a synapsin-1 punctum. Rows represent individual molecular markers as indicated. Synapsin-1 immunoreactivity overlaps with the channels highlighted in red. This GABAergic classified synapse is also positive for pTrkB and two related signaling molecules (red rectangles). (B) Quantification of classified synapse subtypes expressed as mean ± SEM percent of 2N values. n = 3 per genotype. The total number of synapses classified per sample is 81,000-150,000. *p<0.05 versus 2N.

