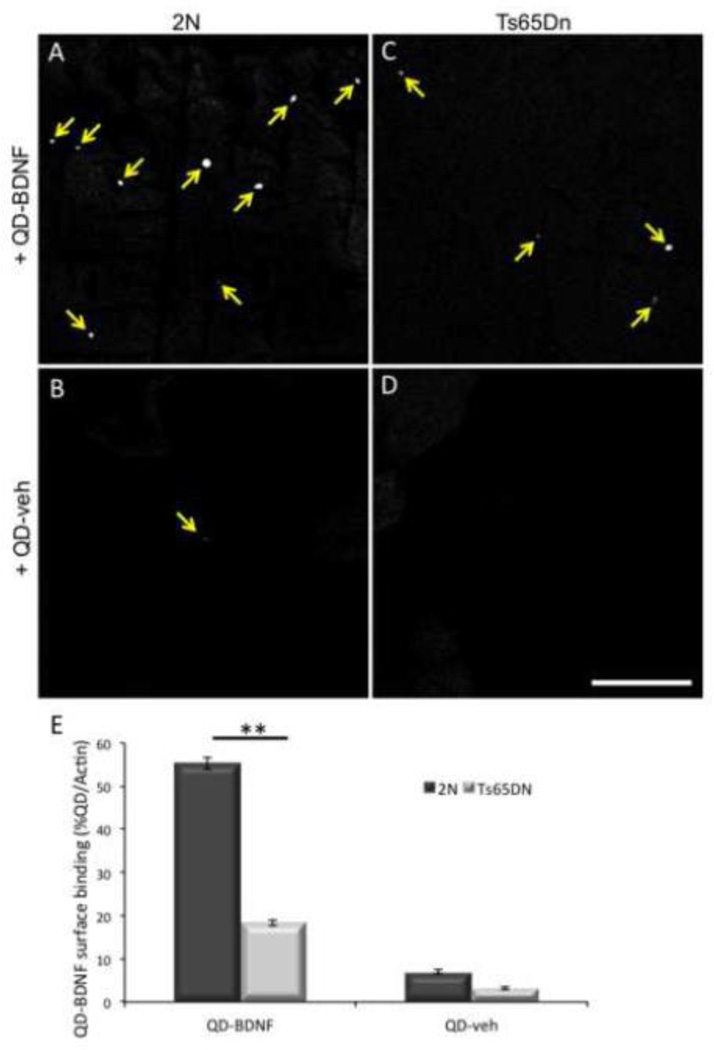
Figure 8. Decreased surface binding of BDNF in Ts65Dn synaptosomes.
2N (A and B) and Ts65Dn (C and D) cortical synaptosomes were incubated with QD-BDNF (A and C) or QD alone (QD-veh, B and D). Yellow arrows indicate QD visualized on the surface of synaptosomes by confocal microscopy. Bar = 100µm. (E) The number of QD, normalized to the total number of actin positive synaptosomes, was quantified in each condition. n = 6 preps per genotype, ** p<0.005 versus 2N.

