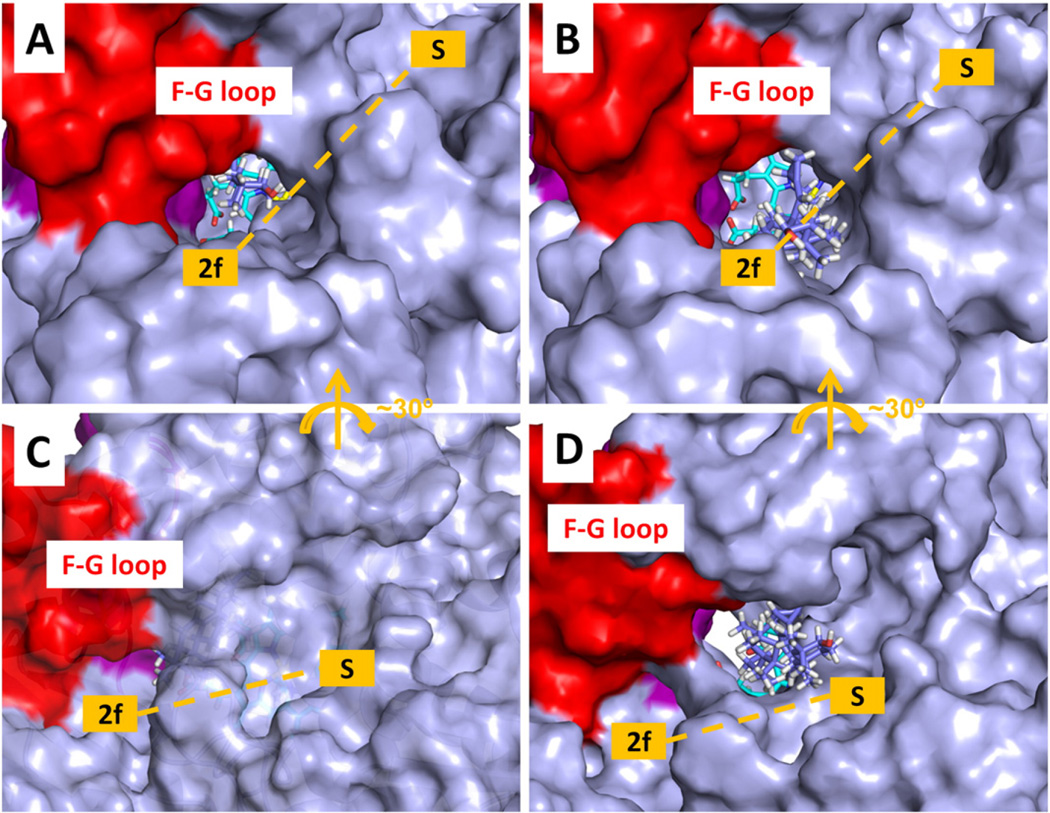
Fig. 11.
Tunnel opening during egress of the ligand MCP from T. brucei CYP51. The protein is shown with a solvent accessible molecular surface representation. The heme is shown in stick representation (cyan carbons) and the ligand MCP is also in stick representation (violet carbons). The F-G loop is shown in red and the B-C loop in purple. (A) First snapshot of a RAMD trajectory with tunnel 2 f open. (B) Snapshot from the same trajectory at 132 ps showing that tunnel 2 f has opened wider to allow the MCP to exit. (C) First snapshot of another RAMD trajectory with the tunnel S closed to a 1.4 Å radius probe. (D) Snapshot from the same trajectory at 902 ps showing that tunnel S has opened wide enough to allow MCP to exit. The white space below the heme cofactor shows the open tunnel W.

