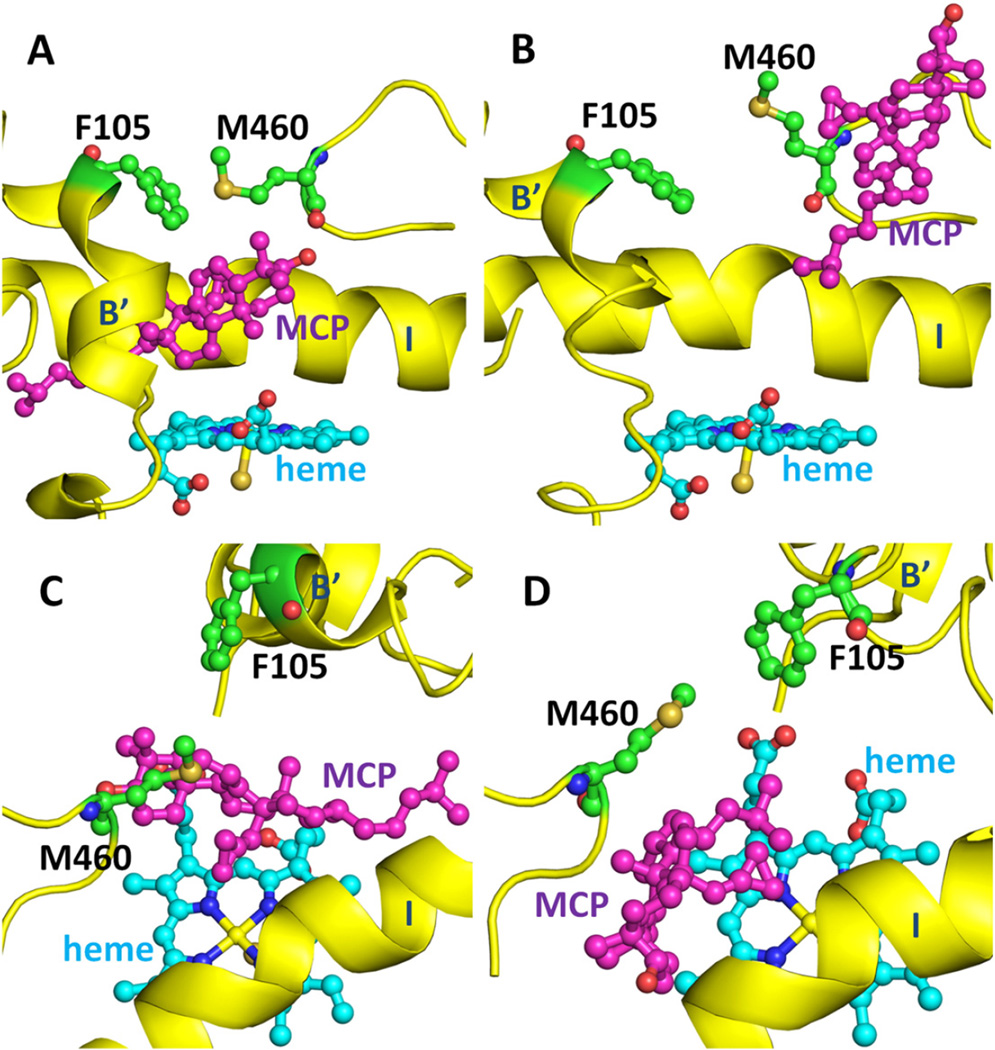
Fig. 12.
Reorientation of the gating residues of tunnel 2 f and tunnel S, F105 and M460, in T. brucei CYP51 during egress of the ligand, MCP. The side chain orientations of F105 and M460 are shown before (A) and during (B) ligand exit via tunnel 2 f and before (C) and during (D) ligand exit via tunnel S. The secondary structure is shown in yellow and the heme in cyan. Different views of the corresponding snapshots with a surface representation of the protein are shown in Fig. S4A–D.

