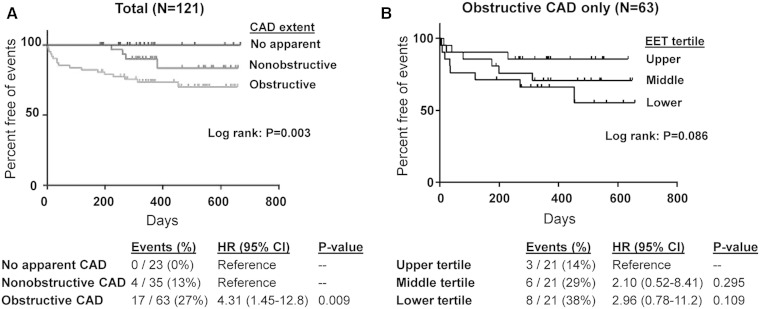
Fig. 3.
CAD extent, EETs, and risk of subsequent cardiovascular events. Kaplan-Meier curves were generated for incidence of the primary end point (time to the occurrence of death from cardiovascular causes, ACS event, or coronary revascularization procedure) according to CAD extent at baseline in all patients with reliable follow-up data (N = 121) (A) and free plasma EET levels at baseline (tertiles) exclusively within the subset of patients with obstructive CAD (N = 63) (B). The log rank P value (unadjusted) for each Kaplan-Meier curve is provided. Below the curves, the number and frequency of events within each CAD extent and EET tertile group, along with the unadjusted hazard ratio (HR), 95% confidence interval (CI), and P value, are provided. Due to the lack of events in those with no apparent CAD at baseline, the no apparent CAD and nonobstructive CAD groups were combined and served as a single reference group.

