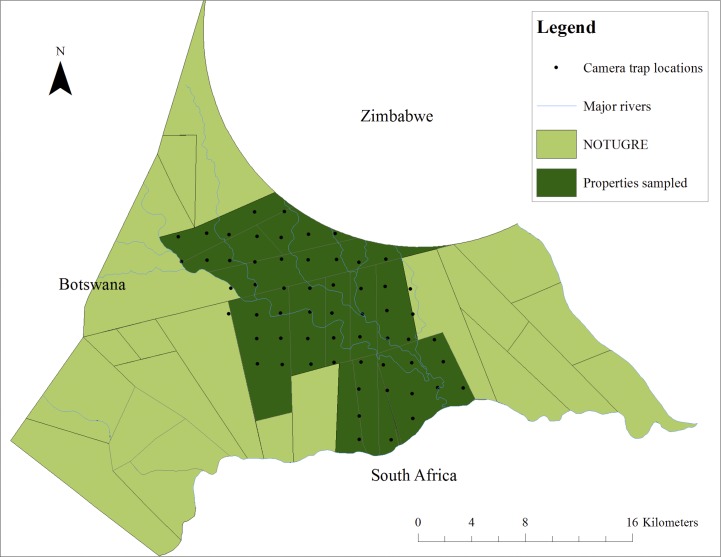
Fig 1. The locations of camera traps (n = 60) for the first survey using a systematic grid method.
Solid blue lines symbolise the major rivers of the area and solid grey lines the boundaries of properties. The green polygons illustrate the properties included in the study area. The camera trap placements are marked as black dots and were chosen within 200m of the predetermined random points (ArcMap 10; projected: Transverse-Mercator, spheroid W GS84, central meridian 29; map units: meters).

