
Fig 14. Cell cycle distribution of HeLa cells treated with different concentrations of ‘fungal VCR’.
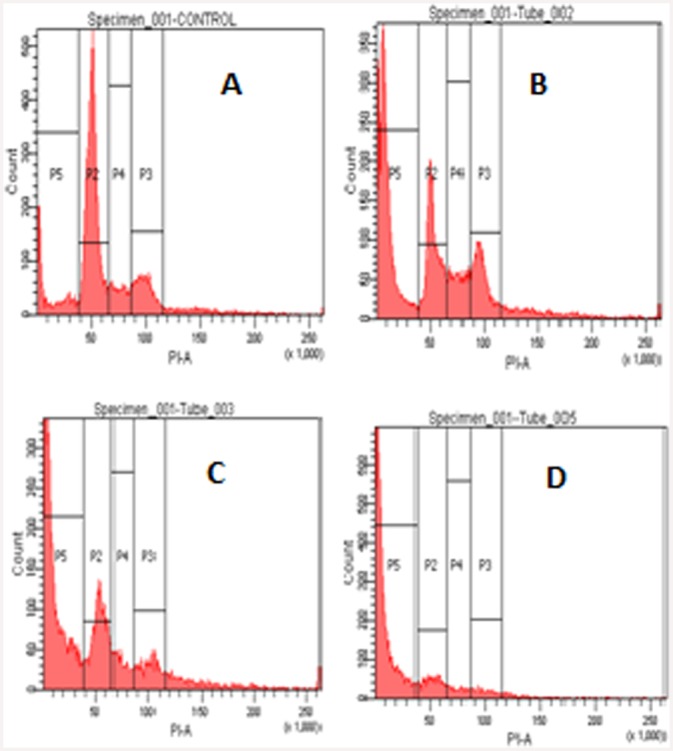
The sub-G0/G1, G1, S and G2/M phases are represented on the histogram as P5, P2, P4 and P3, respectively. A—control, B—fungal VCR (5 μg/ml), C—fungal VCR (10 μg/ml), D—fungal VCR (25 μg/ml) and E—percent apoptosis.