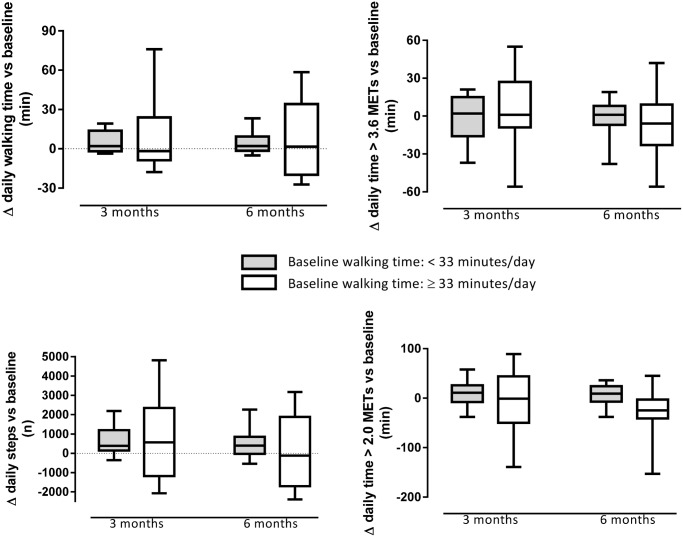
Fig 3. Absolute changes in daily time spent walking, daily steps, daily time spent in at least moderate intense activities (>3.6 metabolic equivalents) and at least mild intense activities (>2.0 metabolic equivalents) after three months (3m) and after six months of rehabilitation (6m) in active and inactive patients at baseline.
A median split of baseline physical activity level is performed for each variable. Data are analysed using mixed models including daylight time as covariate. Box plots indicate median, quartile 1 and 3 and percentile 10 and 90. No Interaction effects (p<0.05) between baseline physical activity and time were identified.

