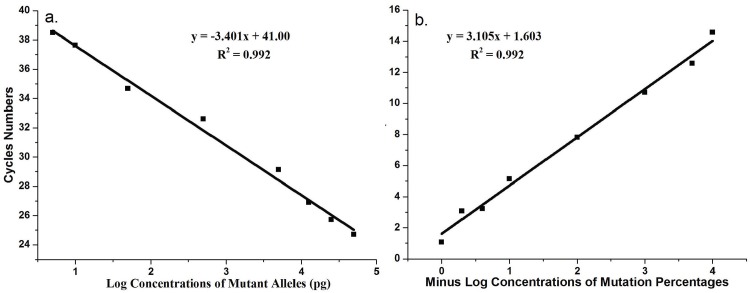
Fig 6. Quantitative curves of real-time WTB-qPCR.
a. A standard curve was generated by plotting the average C q values from real-time WTB-PCR against the log concentrations of mutant KRAS alleles (i.e. 5, 10, 50, 500, 5,000, 12,500, 25,000, 50,000 pg). The total amount of template was 50 ng of genomic DNA containing increasing levels of the mutated c.35G>A allele (i.e. 0.01, 0.02, 0.1, 1, 10, 25, 50, and 100%). The average C q values are shown in Fig 4 and S3 Fig. These were automatically determined with MxPro Software. The amplification efficiency of real-time WTB-PCR was 96.8% (slope, -3.401; R 2 = 0.992). b. A standard curve was generated by plotting the average ΔC q values between real-time traditional PCR and WTB-PCR against minus log percentage concentrations of mutant c.35G>A alleles (i.e. 0.01, 0.02, 0.1, 1, 10, 25, 50, and 100%) in 50 ng of genomic DNA. The standard curves from panel b were used to calculate the percentage of KRAS mutant alleles in heterozygous genomic DNA.

