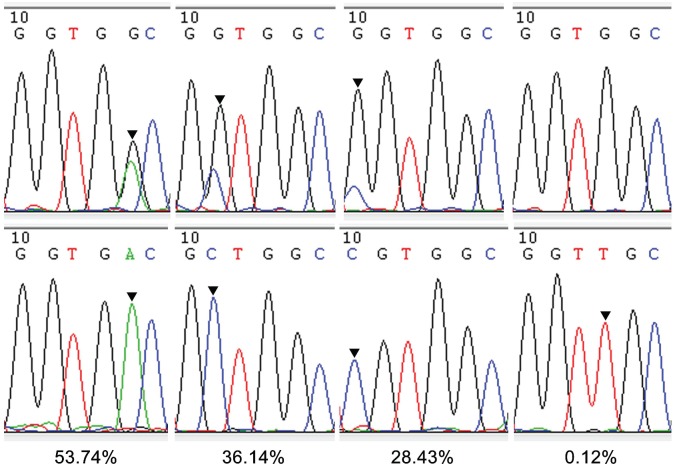
Fig 7. Examples of results obtained from clinical samples.
Sequencing chromatographs are shown for the products from the real-time traditional PCR (top row) and WTB-PCR (bottom row) for three clinical FFPE samples. The numbers at the bottom of each segment indicate the percentages of mutated KRAS allele in the PCR reaction mixtures. The arrows indicate the position of each mutated nucleotide in the KRAS allele.

