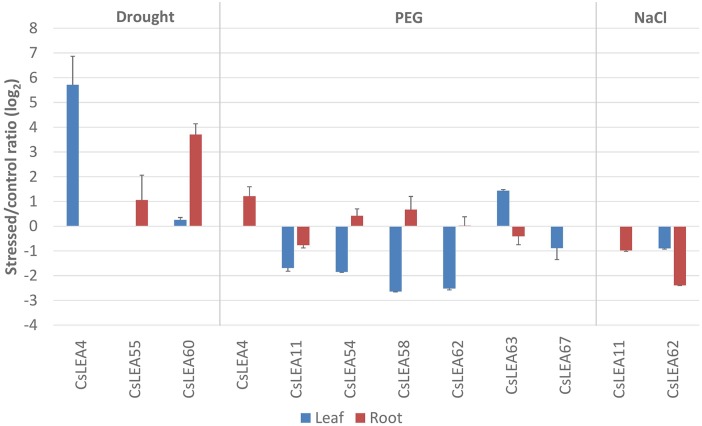
Fig 8. Expression profiles of the differentially expressed CsLEA genes in response to drought, PEG and salt (NaCl) stresses.
Ratios (log2) of relative mRNA levels between stressed and control plants in leaves and roots, as measured by qPCR. GAPC2 was used as an endogenous control. The bars show means ± SE from three biological replicates.

