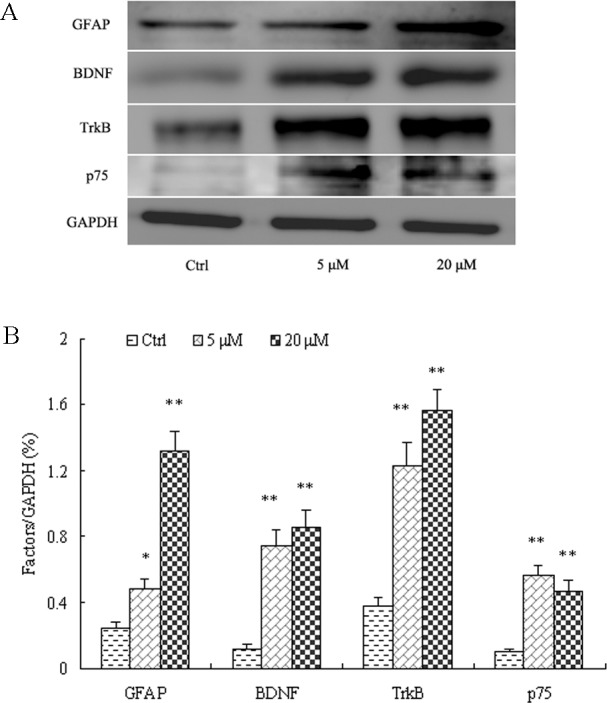
Fig 3. MK-801 enhanced protein expressions levels of GFAP, BDNF, TrkB, and p75 in culture hippocampal astrocytes.

Densitometric values are expressed as the mean ± S.E.M of 3 independent experiments. Statistical differences between groups were determined by one-way ANOVA followed by Newman-Keuls multiple comparison tests. *P<0.05 and **P<0.01 vs. control group.
