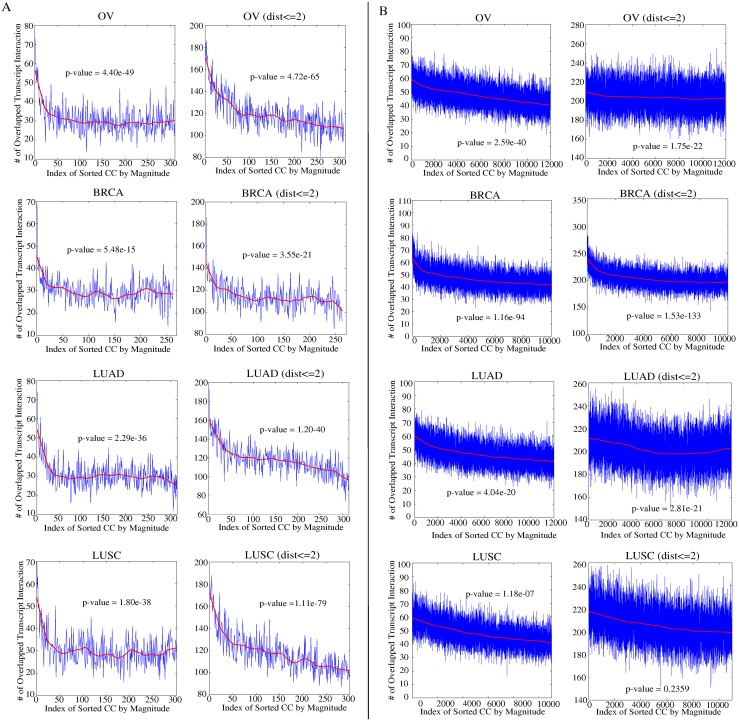
Fig 3. Correlation between transcript co-expression and protein domain-domain interaction in TCGA datasets.
The correlation coefficients between transcript expressions across all patient samples are first calculated in each dataset for each pair of transcripts by Cufflinks. The correlation coefficients are then sorted from largest to smallest and grouped into bins of size 1000 each. The x-axis is the index of the bins with lower index indicating larger correlation coefficients. The y-axis is the number of the pairs among the 1000 pairs of transcripts in each bin that coincide with protein domain-domain interaction between the transcript pair. The red line is the smooth plot by fitting local linear regression method with weighted linear least squares (LOWESS) to the curves. p-value is reported by chi-square test. (A) Co-expressions are calculated based on the small gene list. (B) Co-expressions are calculated based on the large gene list. In both (A) and (B), the left column shows the plots based on the connected transcript pairs in the transcript network and the right column shows the plots based on the transcript pairs with distance up to 2 in the network.

