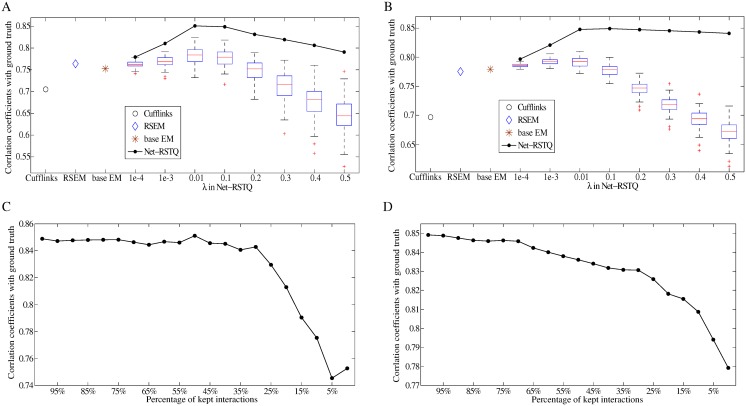
Fig 4. Correlation between estimated transcript expressions and ground truth in simulation.
In (A) and (B) x-axis are labeled by the compared methods and different λ parameters of Net-RSTQ. The bar plots show the results of running Net-RSTQ with 100 randomized networks. In (C) and (D), x-axis are the percentage of edges that are removed from the networks. The plots show the results of running Net-RSTQ with the incomplete networks. (A) and (C) report the results of 109 transcripts of the isoforms in the same gene with different domain-domain interactions. (B) and (D) report the results of 712 isoforms in genes with multiple isoforms.

