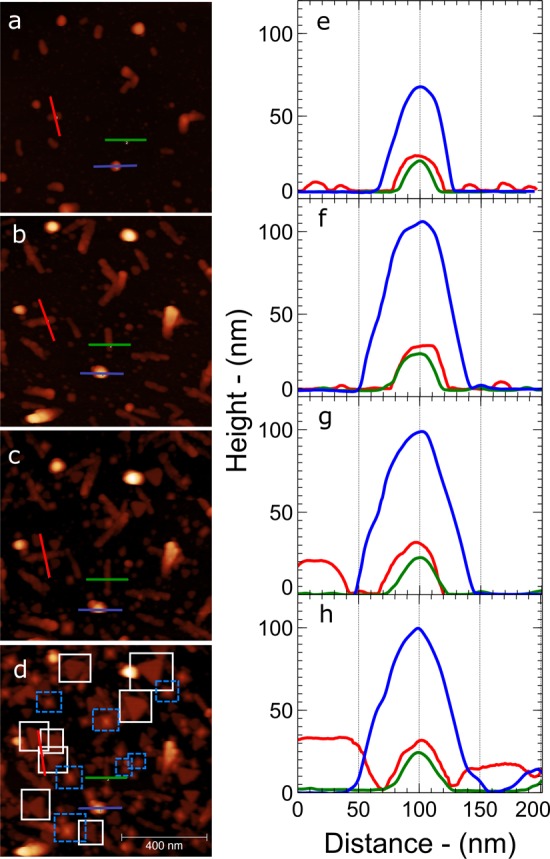
Figure 4.

AFM images of the same 1 μm2 region on an MHDA functionalized Au(111) region shown in Figure 2 b at (a) 1, (b) 3, (c) 5, and (d) 10 cycles of growth, respectively. The blue and white boxes in part d correspond to [111] and [100] oriented crystallites respectively that can be traced throughout the entire growth process. (e–h) Line profiles across the features illustrated in parts a–d, respectively, showing the growth of material across this region.
