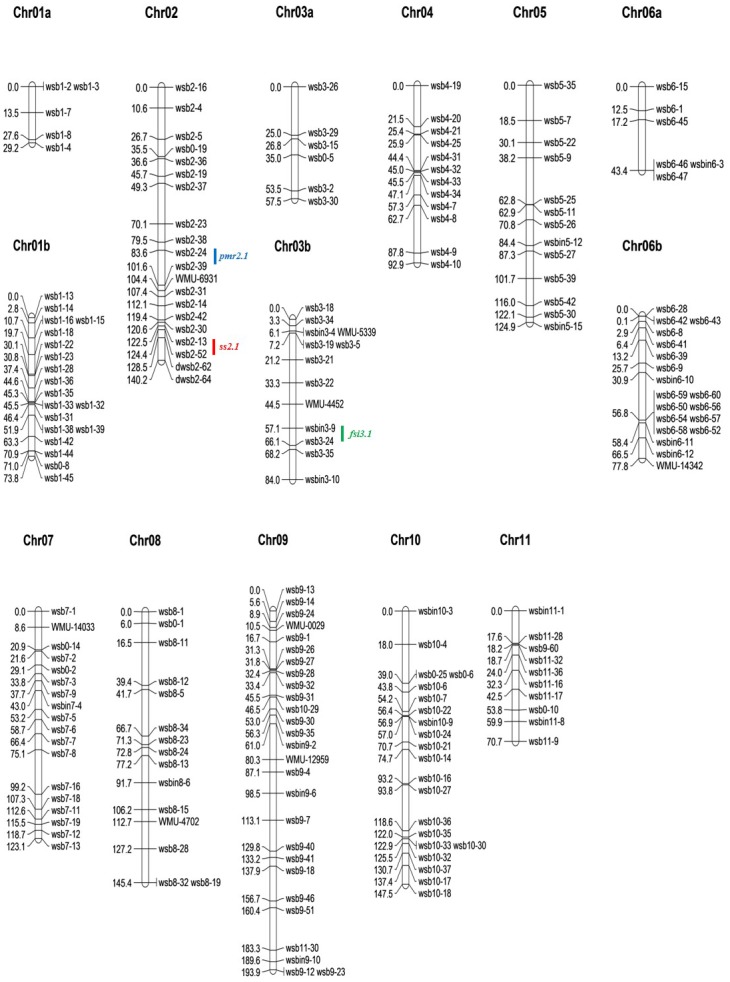
Fig 1. An intraspecific genetic map for watermelon constructed using an F2 population from the cross ‘Arka Manik’ × ‘TS34’ and the location of 3 major QTLs for powdery mildew resistance (PMR), seed size (SS), and fruit shape index (FSI) identified by interval mapping (IM).

Chromosomes 1 to 11 are according to [4]. Numbers on the left side correspond to the distance in cM from the top of each chromosome. QTL positions were defined by the interval of the strongest linked markers flanking the QTL. Major QTL for PMR, SS, and FSI are represented by the blue, red, and green color, respectively.
