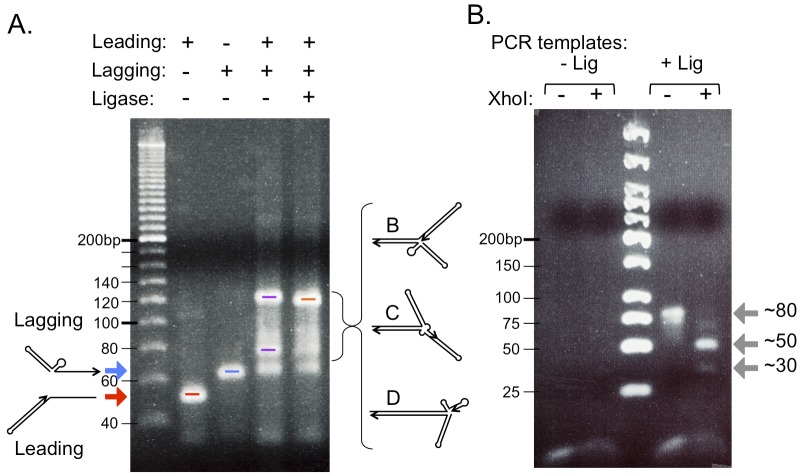
Fig 3. Ligation of leading and lagging “nascent” strands at a replication fork in vitro.
(A) Each oligonucleotide was separately analyzed by electrophoresis in a 3.75% agarose gel after boiling and chilling on ice to allow the hairpins on both oligos to fold (leading strand marked with red arrow, lagging strand marked with blue arrow). The differences in migration of these nearly identically sized oligonucleotides are likely due to their different three-dimensional structures. The two oligonucleotides were mixed (in nearly equal molar amounts), boiled, chilled on ice and then returned to room temperature to allow the two complementary, single stranded tails to anneal. The image of the ethidium bromide stained gel reveals that some unreacted lagging strands remain (blue bar), but the majority of the oligonucleotides have formed higher molecular weight molecules (extremes highlighted with purple bars; intermediates from Fig 2 are labeled B, C, and D). The differences in migration of these molecules with identical mass are likely due to different branching patterns. Addition of DNA Ligase + ATP (last lane on the gel) results in a slightly faster migration of the slowest migrating form (orange bar) relative to its counterpart in the no-ligase lane. (B) Reserved samples from the last two lanes in (A) were used as templates in PCR reactions to detect a covalent linkage between the two oligonucleotides across the fork. PCR primers were designed such that their 3’ends resided in the single stranded linkers at the distal arms of the leading and lagging strands (see Fig 2C). The image of the ethidium bromide stained 3.75% agarose gel reveals a PCR product of 78 bp that can be cleaved by XhoI into 47 and 31 bp fragments (gray arrows).

