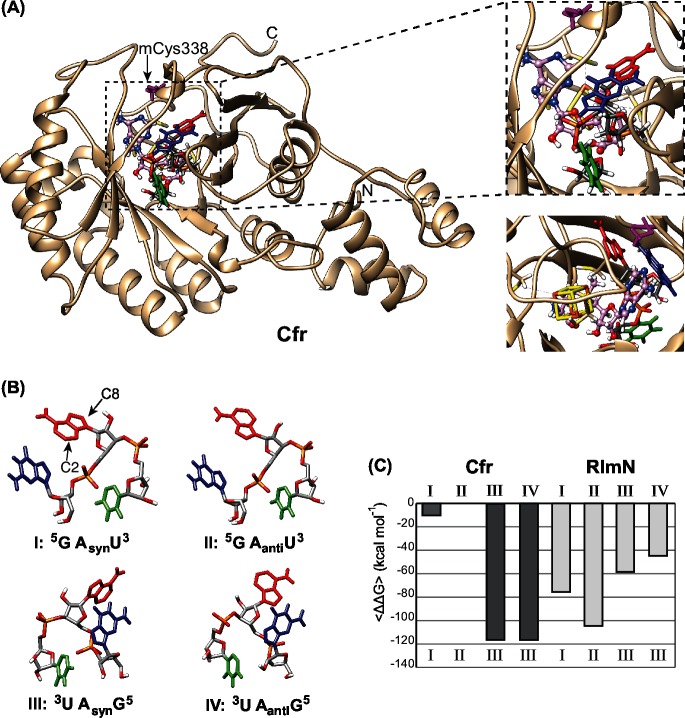
Fig 2. The Cfr structure model, the four starting poses of ligand GpApU and target binding affinities.
(A) The whole Cfr model structure is shown at the left in tan with a trinucleotide target, a SAM molecule and a [4Fe-4S] cluster at the active site. The blow up at the right shows a detailed view of the active site with SAM in pink ball and sticks, the [4Fe-4S] cluster in yellow sticks and GpApU in sticks colored as in (B). The mCys338 is shown in purple. The blow up below corresponds to an approximately 120° turn of the active site. (B) Illustration of the four starting poses used for the MDs with guanine in blue, adenine in red and uracil in green and their labels used in the text below. (C) The data of the average binding energy of the trinucleotide ligand binding to Cfr or RlmN presented as relative differences. Each column represents the <ΔΔG> data from ten snapshots of a trajectory. The MDs started with the poses corresponding to the numbers above the columns while the resulting poses of the ligands are depicted below the columns.

