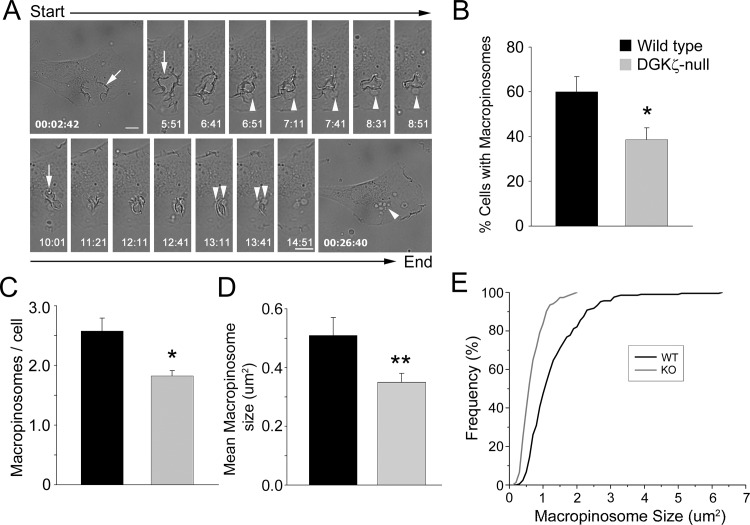
Fig 1. Quantitative analysis of macropinocytosis in living wild type and DGKζ-null fibroblasts.
(A) Representative phase-contrast images captured from time-lapse video microscopy of PDGF-stimulated, wild type fibroblasts show macropinosomes (arrowheads) forming from membrane ruffles (white arrows). Two separate sequences (top and bottom) are shown from a 30 min video. Scale bar, 10 μm. (B-D) Graphs showing the percentage of cells with macropinosomes (B), the number of macropinosomes per cell (C) and the mean macropinosome size (D) in wild type and DGKζ-null fibroblasts following 30 min PDGF stimulation. Values are the mean ± SEM from at least four independent experiments. A single asterisk denotes a significant difference (p<0.05) and two asterisks, a highly significant difference (p<0.01), between wild type and null cells by Student’s t test. (E) Cumulative frequency distribution showing the distribution of macropinosome sizes (defined as the two-dimensional area) in PDGF-stimulated wild type and null cells.

