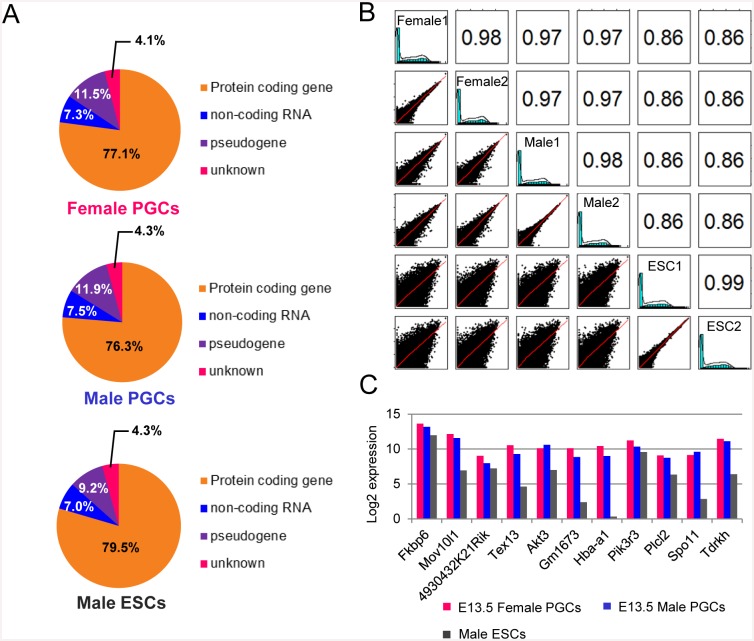
Fig 1. RNA-seq transcriptional profiling of female and male PGCs.
(A) Pie charts showing the composition and quantity of each reference gene type in the UCSC Genome Browser for each RNA-seq dataset. (B) Comparative analysis of reference gene expression levels in each RNA-seq dataset. The left side-scatter plots display the relationship between each gene expression pattern. The right side numbers are the Pearson’s correlation coefficients. (C) PGC-specific gene expression patterns (11) in each RNA-seq dataset. Expression levels are shown in log2 values.

