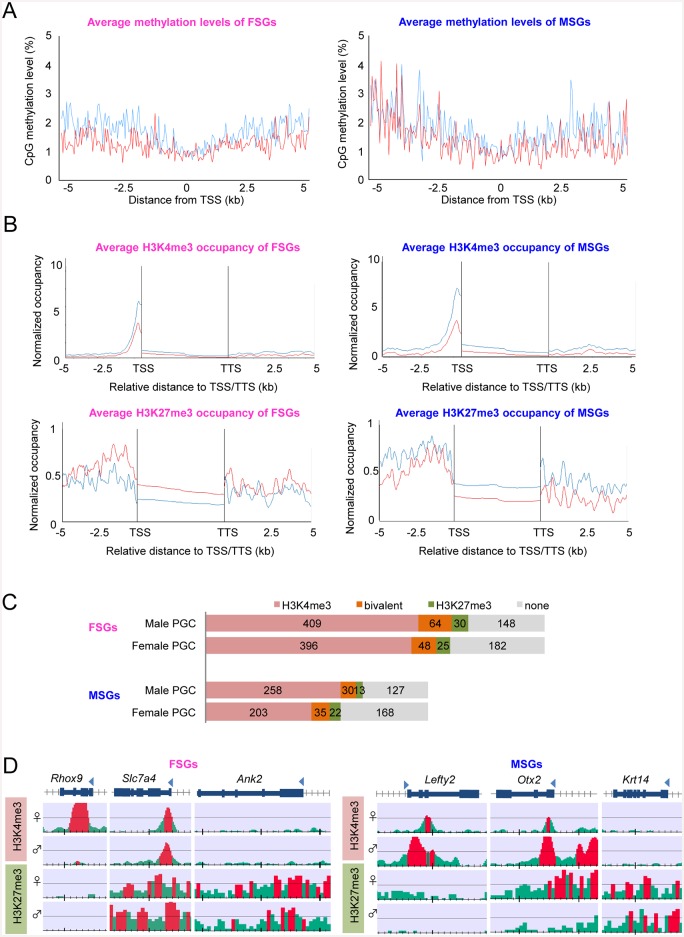
Fig 4. DNA methylation and histone modifications in female- and male-specific PGC-expressed genes.
(A) Average methylation levels of TSS and the shore values (±5 kb of the TSS) in female- and male-specific PGC-expressed genes. Our previous methylation data of PGCs were obtained from the DDBJ database [12]. (B) Occupancy of H3K4me3- and H3K27me3-bound TSS and TTS shore regions (±5 kb of the TSS and TTS) in female- and male-specific PGC-expressed genes. (C) Proportion of genes showing histone-modification patterns. The number of genes classified into each histone-modification pattern is shown. (D) Three typical histone-modification patterns. The red regions indicate ChIP/input enrichment-peak regions that were calculated using the DROMPA peak-calling program.

