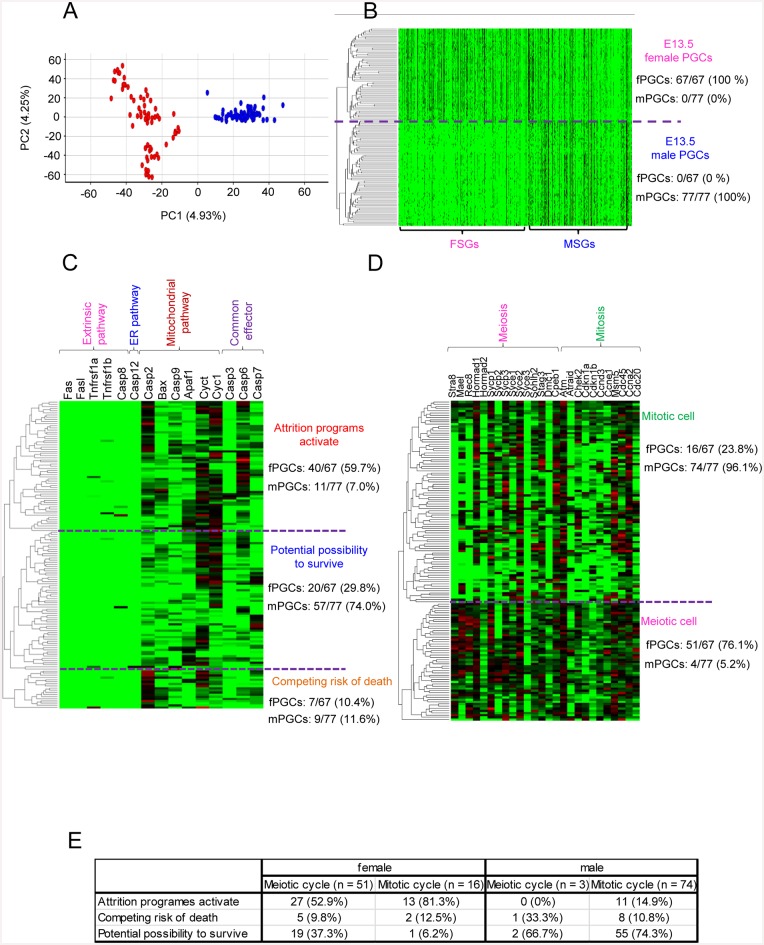
Fig 6. Single-cell transcriptome analysis of E13.5 female and male PGCs.
(A) Bi-dimensional PCA of E13.5 female and male single-PGC gene expression patterns. The first principal component (PC1) captures 4.93% of the gene expression variability and the second principal component (PC2) captures 4.25%. The red and blue spheres represent single female (n = 67) and male (n = 77) PGCs, respectively. (B) Hierarchical clustering analysis of transcriptome data sets (FSG: 651, MSG: 428) of female and male single PGCs. (C) Heat map of the relative expression of apoptotic process-related genes (n = 15). (D) Heat map of the relative expression of meiotic and mitotic cell cycle-related genes (n = 26). (E) Relation between apoptosis and meiotic and mitotic cell cycle in female PGCs. The numbers indicate the number of PGCs.

