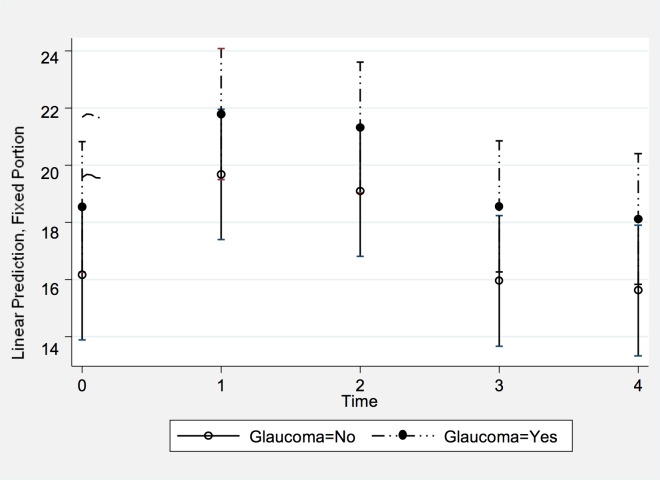
Fig 7. Least squares means and mean values of the covariates of the changes in IOP in the Viparita Karani position over time.
The X axis represents each time point an IOP measurement was taken (0 = Baseline seated; 1 = Immediate position; 2 = 2 minutes position; 3 = Post position seated; and 4 = 10 minutes post position seated). The Y axis represents the IOP in mmHg after adjusting for the covariates. Subjects with glaucoma diagnosis are depicted ‘Glaucoma = 1’; controls are ‘Glaucoma = 0’.

