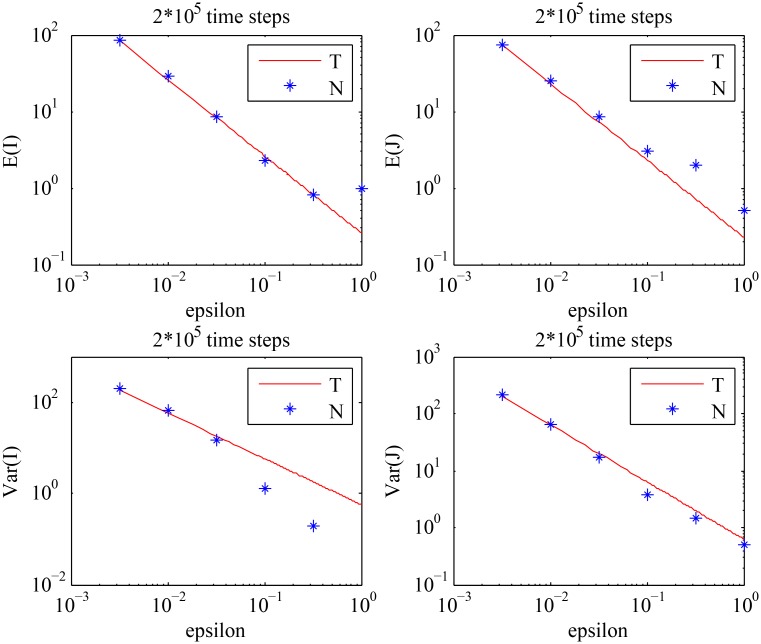
Fig 5. The behavior of the means and the variances of the cell population described by Eq (1).
The analytical results given by Eqs (2–5) (solid line) are compared with the values obtained by numerical simulations (stars), for different values of ϵ with the fixed value of S: S = 0.5. The choice of S should satisfy: S = S * < S c, where S c is given by Eq (29). (‘T’) stands for the theoretical results, and (‘N’) stands for the numerical results.

