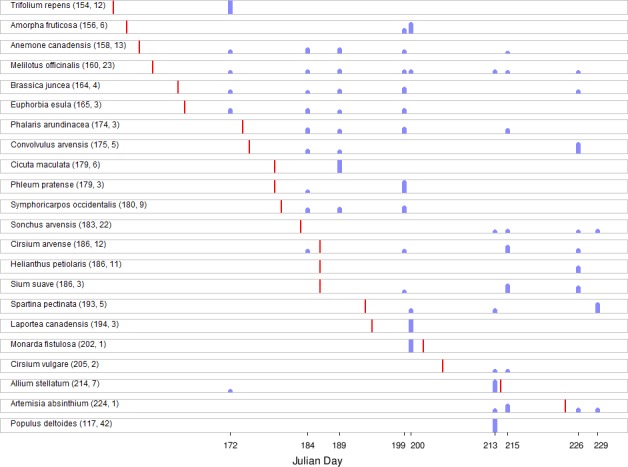
Fig 3. The proportion of total counts per million mapped reads (cpm) by sampling date for plant taxa with phenological records in [45] that overlap the range of pollen sampling dates.

Red bar shows mean Julian date of first flowering from [45] relative to sampling dates (blue bars). Values in parentheses following the species name are the mean date of first flowering and the number of observations underlying that mean, respectively. Three sampling dates after Julian day 228 are omitted to avoid compressing the horizontal axis unnecessarily, as no first flowering dates occurred in that time frame for species in our sample. No red bar is shown for Populus deltoides because that mean day of first flowering is outside the range of the horizontal axis; this was also done to avoid compressing the axis.
