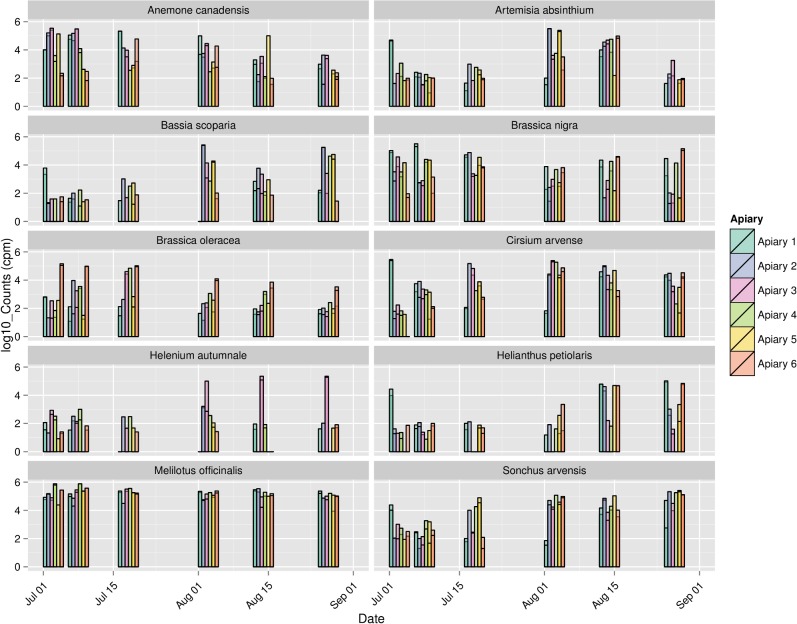
Fig 5. Forage calendar highlighting variation in pollen collection among 6 apiaries in 2009.
Combined OTU counts for each of the 10 most common plant species-level assignments, based on the summed counts for all apiaries in 2009, are represented. Vertical axis represents the log10 transformed counts per million mapped reads (cpm) for each taxon at each sampling point. Vertical bars are transparent to show data for multiple colonies sampled within the same apiary.

