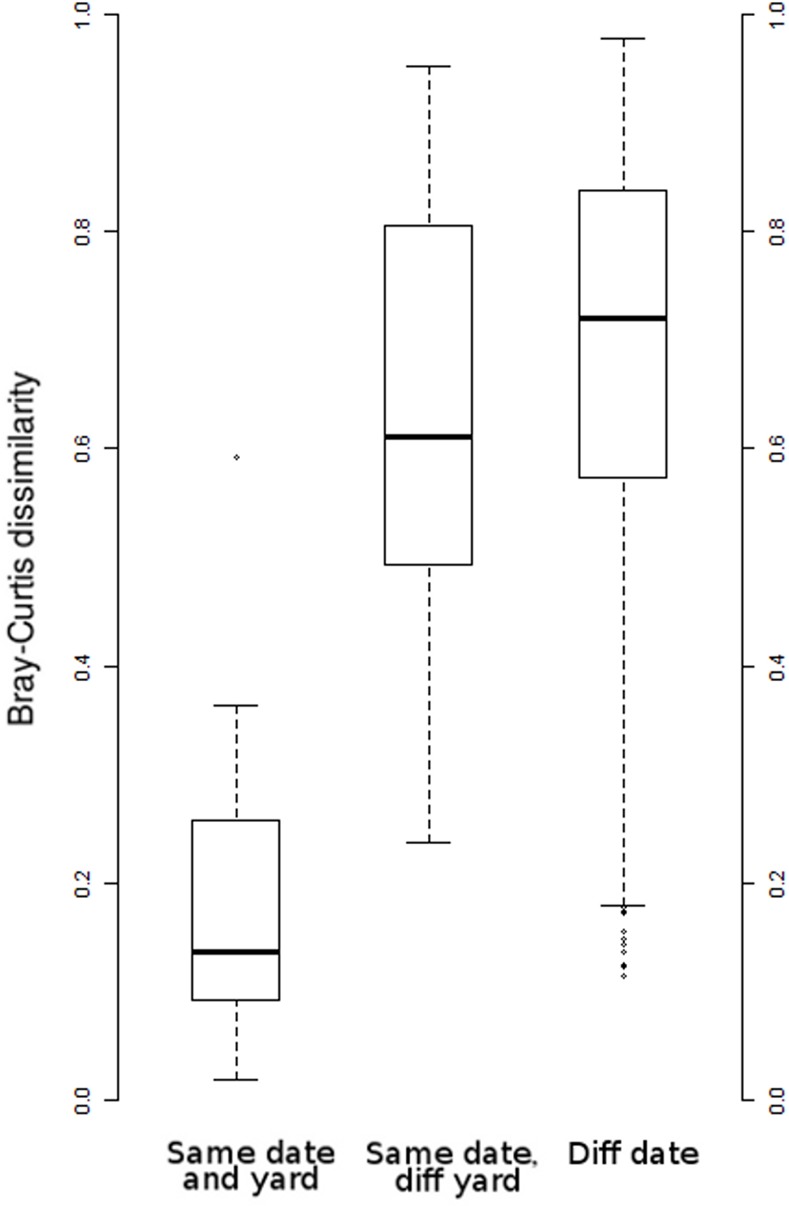
Fig 6. Box plots of pairwise Bray-Curtis dissimilarities computed with Megan v. 5.10.2 [52].

The range of possible values is 0–1. Only 2009 samples were compared as relatively few 2010 biological replicates were available and a year-effect on phenology is possible. Samples collected from different hives but from the same date and apiary were more similar than samples collected from different dates and apiaries. This indicates that variation among biological replicates is lower than spatial or temporal variation in foraging.
