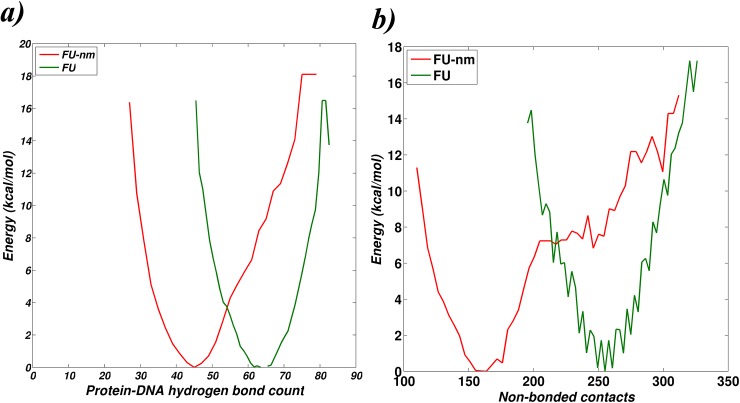
Fig 7. Influence of metal on the energy landscape of IdeR-DNA complex.
Y-axis represents the statistical free energy evaluated with respect to a) number of hydrogen bonds between protein and DNA and b) the number of non-bonded contacts between the protein and DNA. These two parameters broadly define the extent of protein-DNA interaction. Profiles shown in red are for the non-metallated system [FU-nm], while those in green are for the metallated system [FU-m].

