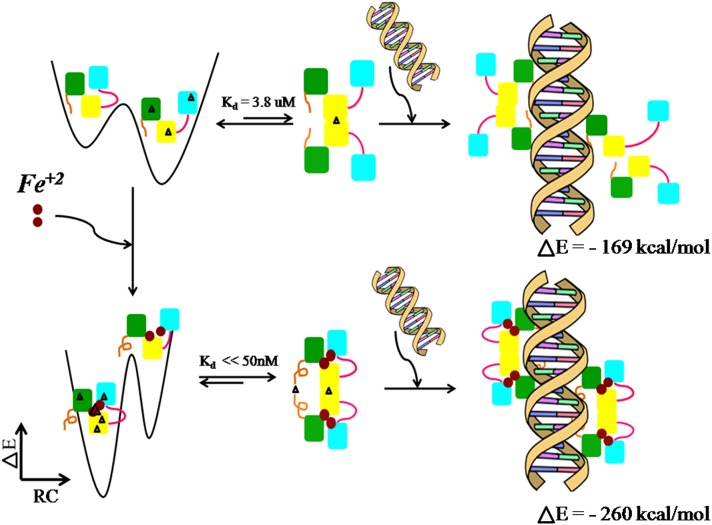
Fig 8. Proposed model of IdeR activation and DNA binding.
A schematic representation of the various steps involved in IdeR activation as DNA binding as understood from experimental as well as simulations studies is provided. The three domains of IdeR monomer are represented in different colours, green–DNA binding domain, yellow–dimerization domain, and cyan–SH3 domain. The N-terminal region is shown in brown and the linker region is represented in magenta. The black triangles in the structure represent network connectivity as obtained from Protein Structure Network analysis. The top three panels correspond to the population distribution of the ‘open’ and ‘closed’ states of IdeR in the monomeric form, cartoon diagram of the dimeric form, and the DNA complexed with four units of IdeR, in the absence of metal ion. The three panels in the bottom row correspond to the same in the presence of metal ion.

