
Fig 1. Proportion of simulations detecting differences between indicators in predicting resistance prevalence, for ten combinations and five durations.
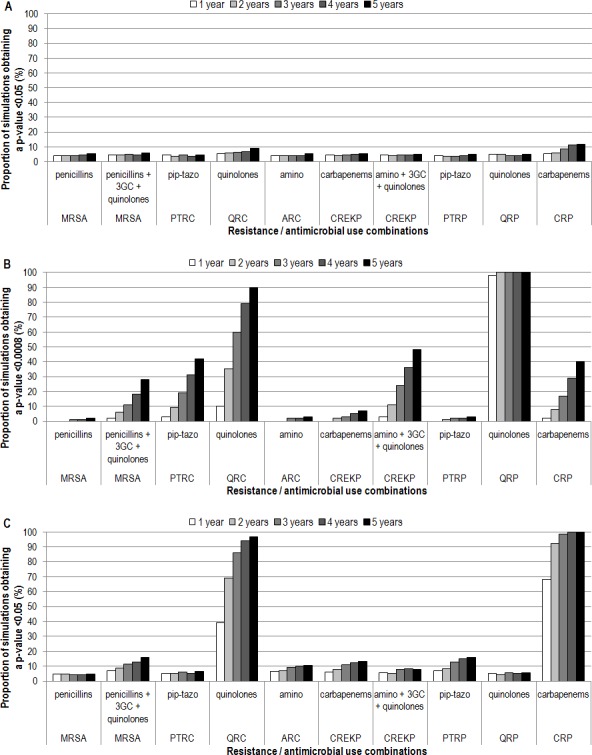
A) Network of ICUs similar to SPIN-BACTOT’s ICU network, comparing the two most accurate indicators. B) Network of ICUs similar to SPIN-BACTOT’s ICU network, comparing the most accurate indicator to the least accurate. C) Network of ICUs similar to the NHSN, comparing the two most accurate indicators. 3GC: third-generation cephalosporins; amino: aminoglycosides; ARC: aminoglycoside-resistant coliforms; CREKP: carbapenem-resistant E. coli, Klebsiella sp. and Proteus sp.; CRP: carbapenem-resistant Pseudomonas sp.; ICU: intensive care unit; MRSA: methicillin-resistant Staphylococcus aureus; NHSN: National Healthcare Security Network; pip-tazo: piperacillin-tazobactam; PTRC: piperacillin-tazobactam-resistant coliforms; PTRP: piperacillin-tazobactam-resistant Pseudomonas sp.; QRC: quinolone-resistant coliforms; QRP: quinolone-resistant Pseudomonas sp.; SPIN-BACTOT: Québec healthcare-associated bloodstream infections network.