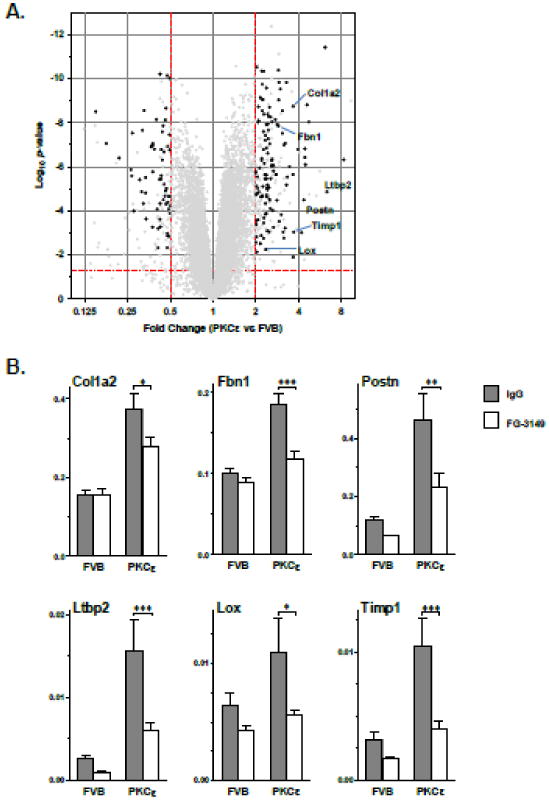
Figure 3. Inhibition of CTGF signaling reduces the PKCε-induced pro-fibrotic gene signature.

(A) Volcano plot of cardiac gene expression changes in IgG-treated PKCε mice vs. IgG-treated FVB mice for all genes with mean raw fluorescence values >50 in at least one group. Black circles indicate the PKCε-altered genes (Fc>2, P<0.05) that were partially reversed by FG-3149 vs. IgG in PKCε hearts (P<0.05). (B) Validation of select ECM and ECM remodeling genes by qPCR. Grey and white bars indicate IgG and FG-3149 treatments, respectively. Actb-normalized expression (mean ± SEM) was altered by genotype (P<0.0001) and treatment (P<0.05) for all genes (2-way ANOVA). Bonferroni post-test P<0.05 (*), 0.01 (**), or 0.001 (***). Additional qPCR results are provided in Online Figure V.
