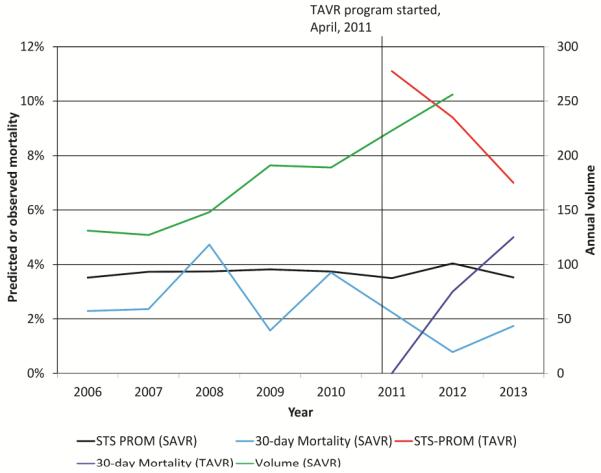
Figure 1.

Temporal trends in SAVR and TAVR predicted and observed mortality and institutional SAVR case volume over the study period. Annual case volume is displayed on the right axis, while annual mean predicted and observed mortality rates are on the left axis.
