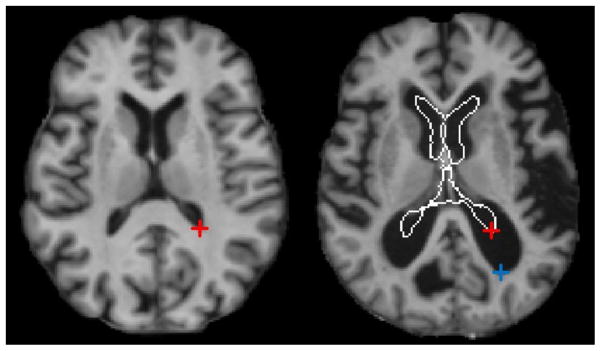
Fig. 1.
An example showing the large difference between ventricular regions in the two MR brain images. The boundary of ventricular region in the left image is overlaid on the right image. The red and blue cross marks denote the reference and the corresponding points in the two images, respectively. The distance between two cross marks in the right image is about 19mm.

