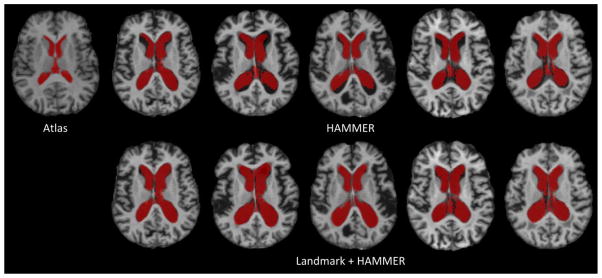
Fig. 13.
The labeling results for the ventricular regions in 5 testing images. The fixed image in Fig. 11 was used as the atlas, and the ventricle label in the atlas was mapped to the 5 moving images in Fig. 11 by using the deformation fields estimated by image registration. Labeling results given by both HAMMER (first row) and Landmark+HAMMER (second row) are presented.

