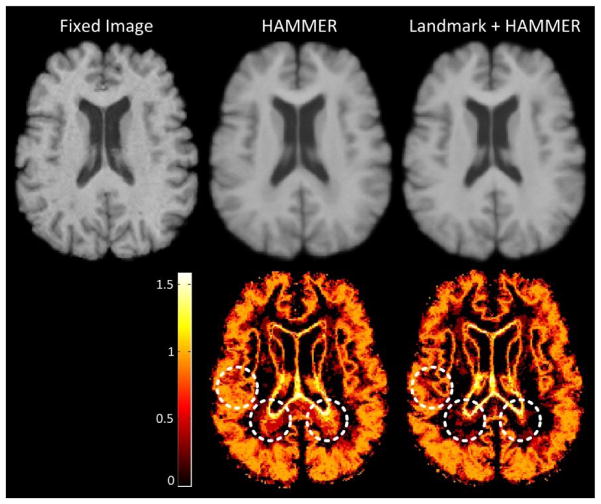
Fig. 15.
This figure illustrates the registration performance of the original HAMMER and the Landmark+HAMMER approach on the 18-Elderly-Brain dataset. The first row shows the fixed image and the average images of all warped moving images produced by HAMMER and Landmark+HAMMER, respectively. The second row shows the corresponding entropy maps of tissue type probability for the two methods. Higher brightness indicates less registration consistency.

