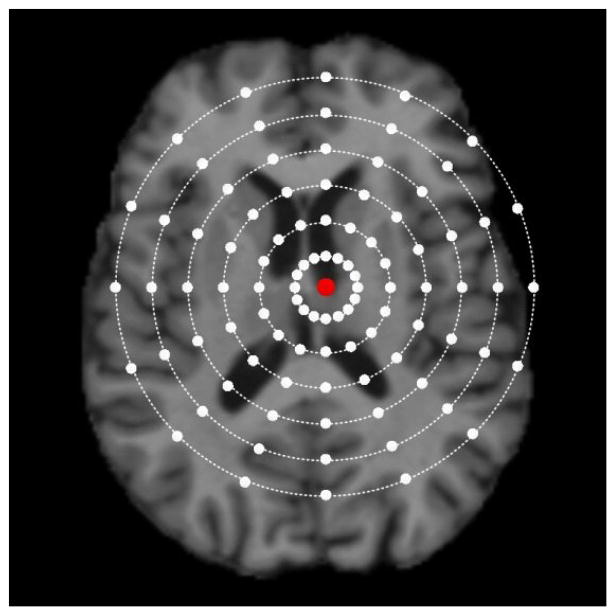
Fig. 3.
A sketch diagram of spherical sampling in the training image. The red dot denotes the annotated landmark and the white dots denote the sampled image points. More points are sampled near the annotated landmark so that the prediction reliability and accuracy of image points close to the landmark can be improved.

