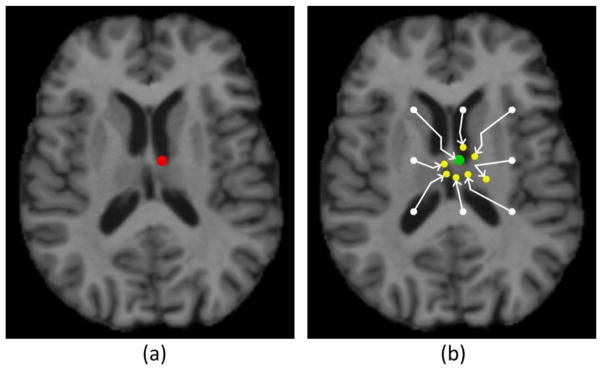
Fig. 4.
A sketch diagram of the “point jumping” strategy. The red dot in (a) denotes the true landmark location, the white dots in (b) denote the initial locations of the points, and the green and yellow dots in (b) denote the locations of the points after jumping. The green dot is the final predicted landmark location.

