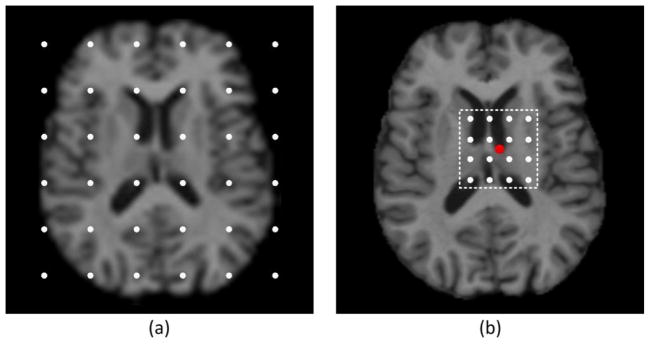
Fig. 5.
The image point sampling strategies for the coarsest resolution (a) and a finer resolution (b), respectively, in the application stage. For the coarsest resolution, a set of grid points (white dots in (a)) are sampled from the entire image. For a finer resolution, grid points (white dots in (b)) are sampled only near the predicted landmark location (red dot in (b)) from the previous resolution.

