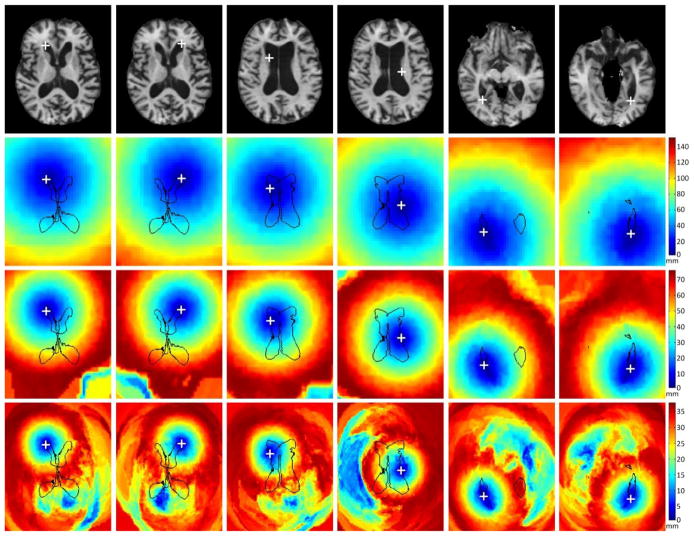
Fig. 8.
The six annotated landmarks in one testing image (first row) and their corresponding distance maps at 3 different resolutions (the remaining 3 rows: from coarse to fine resolutions). The white crosses mark the locations of the annotated landmarks. The distance maps are obtained by calculating the distance between each image point and the latent landmark based on the regressed displacement from the learned regression forest.

