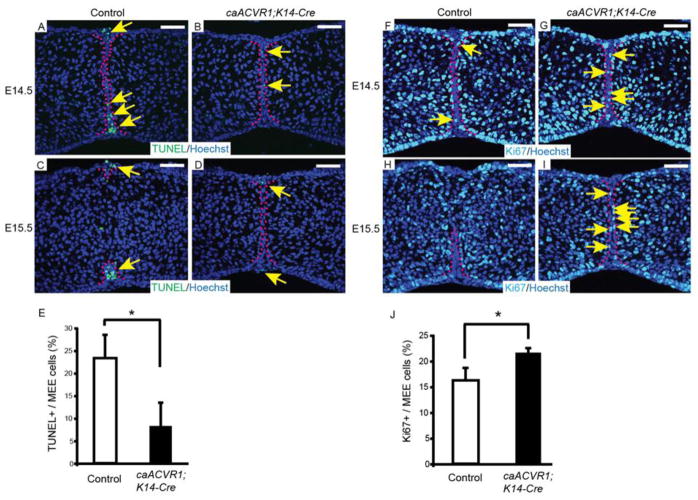
Fig. 4. The fate of MEE cells was altered in caACVR1;K14-Cre embryos.
(A–D) TUNEL staining of sections of control (A, C) and caACVR1;K14-Cre (B, D) palates at E14.5 (A, B) and E15.5 (C, D). Red dashed lines outline the MEE cells. Arrows indicate TUNEL-positive cells (green) in the MEE. (E) Quantification of the number of TUNEL-positive cells in the MEE of control (n = 3) and caACVR1;K14-Cre (n = 3) palates at E14.5. Error bars represent s.d., *P = 0.023. (F–I) Ki67 staining of sections of control (F, H) and caACVR1;K14-Cre (G, I) palates at E14.5 (F, G) and E15.5 (H, I). Red dashed lines outline the MEE cells. Arrows indicate Ki67-positive cells (light blue) in the MEE. (J) Quantification of the number of Ki67-positive cells in the MEE of control (n = 3) and caACVR1;K14-Cre (n = 3) palates at E14.5. Error bars represent s.d., *P = 0.021. Scale bars, 50 μm.

