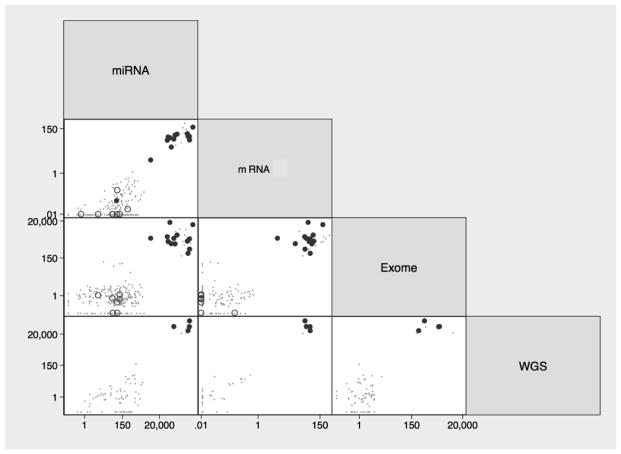
Figure 2.
Pairwise comparisons of normalized EBV read counts in gastric cancer tissues by whole genome (WGS), exome, mRNA and miRNA sequencing. Solid circles represent EBER-positive tumors (n=14), open circles represent EBER-negative tumors (n=9) and dots indicate TCGA tumors not tested by in situ hybridization (n=272).

