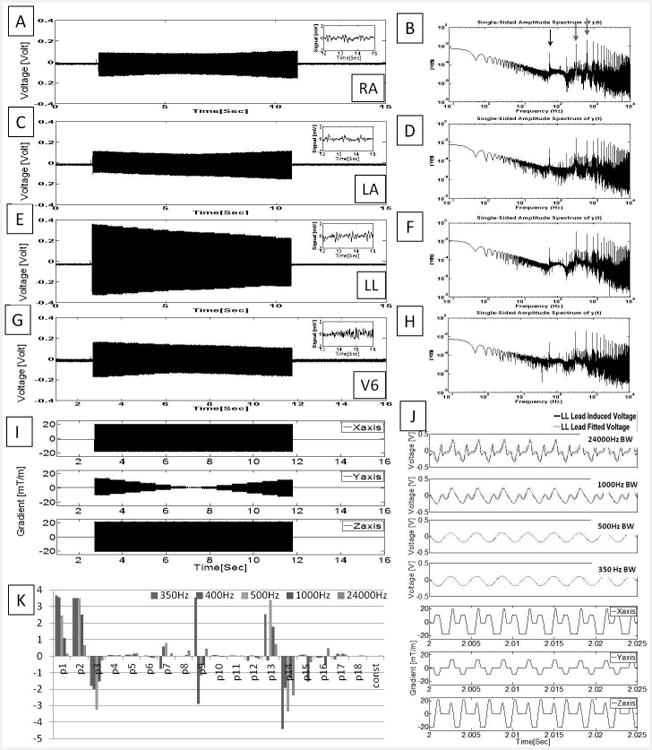
Figure 1.

Unfiltered ECG traces recorded at a rate of 48 kHz during an axial bSSFP scan using acquisition Set-up I. (A, C, E, G)Voltages measured during imaging from three limb leads (LA, RA and LL) and the precordial lead with the largest induced voltage, V6'. Insets showed 30Hz low-pass filtered ECG (in mV) extracted from the period without gradient activity. (B, D, F, H) Spectral analysis from 0.1-10KHz. Notable peaks (red arrows) are seen at the fundamental (320 Hz) and 2nd harmonic (640 Hz) corresponding to the repetition time (TR) and at 60 Hz noise (black arrow). (I) Gradient waveforms simultaneously recorded while imaging. (J) Expanded induced noise in LL traces filtered below noted frequencies (black traces), overlaid on data fitted to the 19-parameter equation (green traces), and corresponding gradient waveforms (blue traces). (K) The 19-parameter plot for ECG traces with the bandwidths of (I), and their units are listed in Table 1. Note that even at 350 Hz bandwidth, some 2nd order coefficients remain very large.
