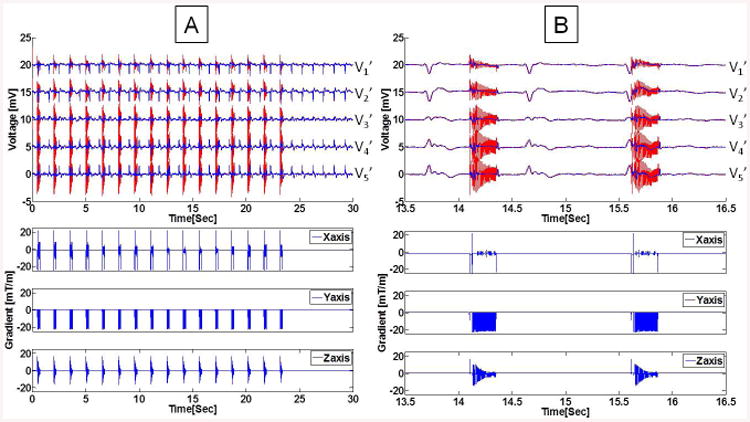
Figure 5.

Example of ECG traces during a coronal 3D FSE sequence, collected with Set-up II. (A) Imaging sequence consisting of 16 echo trains, followed by clean ECGs. The restored ECG signal, after subtraction of the 19-parameter system response function, resulted in the blue traces. (B) Expanded view of two FSE bursts show the strong induced voltage at the beginning and end of each echo train (red traces), which are not completely corrected by the 19-parameter equation. The echo train bursts fell in different cardiac cycle phases, due to the use of non-ECG-gated acquisition. V6' was acquired with low quality and omitted in this plot.
