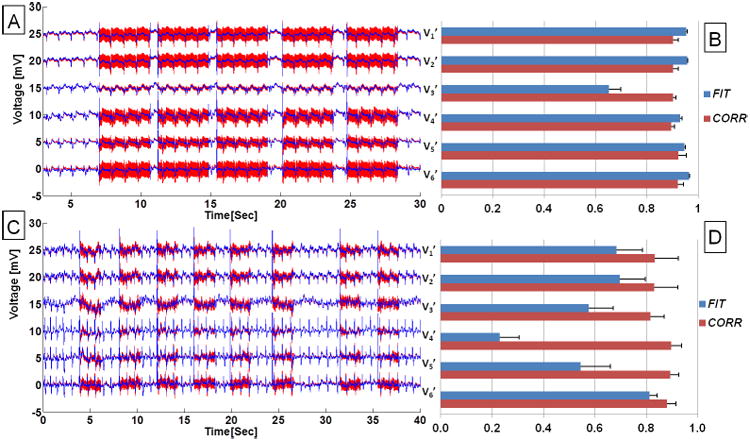
Figure 6.

ECGs acquired in a volunteer during a multi-slice bSSFP full resolution acquisition. Precordial ECG traces acquired with set-up II during (A) a stable physiological condition, and (C) relaxation following leg exercises inside the scanner with heart rate dropping from 90 to 70 BPM. Red traces are acquired ECG traces and blue traces are after removal of gradient-induced voltages using the 19-parameter fit. (B, D) Bar plots showing statistics of fit for ECGs acquired and recovered during acquisition of the 5- and 8-parallel bSSFP slices, respectively. FIT and CORR were defined in Eq. 3 and 4, correspondingly.
