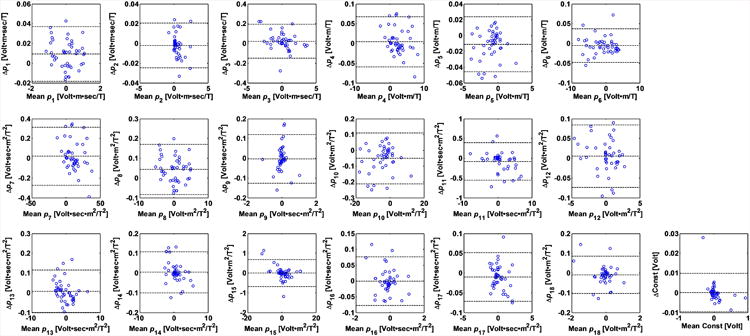
Figure 8.

Repeatability measurement of the parameter fitting shown in Bland-Altman plots of all 19 parameters in their SI units listed in Table 1. The 3 dotted lines within each plot indicate upper 95% confidence interval, average, and lower 95% confidence interval of the parameter fitting. The vertical axis represents the difference of the parameters of the repeated scans, and horizontal axis represents the average of the parameters of the repeated scans. ECGs were collected twice during the acquisition of bSSFP sequences along each of 9 different spatial orientations. Since the fitted parameters varied as the orientation changes, a large variation in the fit parameter values can be observed (the abscissa of the graphs). Variations in the fitted parameters can be observed in the small size of the vertical dimension.
