
Fig. 2.
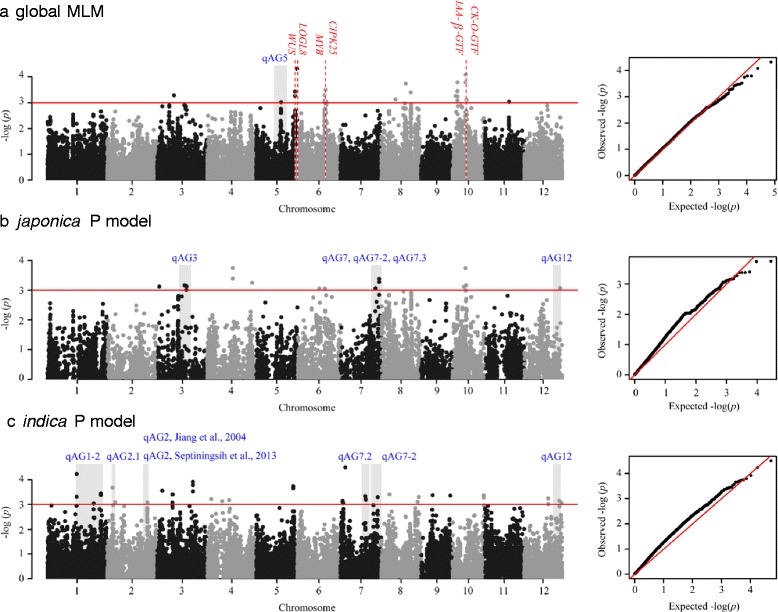
Manhattan plot of the SNPs associated with anaerobic germination. The red horizontal line indicates the significance threshold of multiple comparisons (P < 0.001). Genomic regions detected by our GWAS and previous biparental mapping studies are labeled with published QTLs in blue text. Candidate genes near the significant SNPs are indicated with a red vertical dashed line. The Q-Q plot corresponds to the fitness of the model