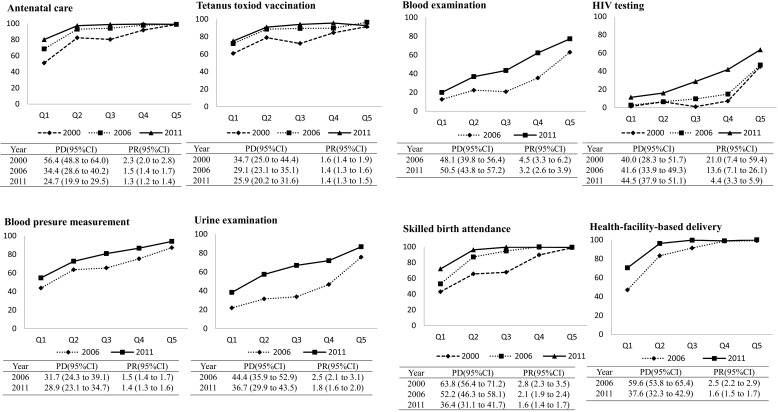
Figure 1.
Trends in utilization of reproductive health services by wealth index category (Wealth index quintiles: Q1, poorest; Q2, poorer; Q3, middle; Q4, richer; Q5, richest), Vietnam, 2000–2011. PD, prevalence difference comparing Q5 with Q1; PR, prevalence ratio comparing Q5 with Q1. The vertical axis represents the percentage of women who utilized the service.

