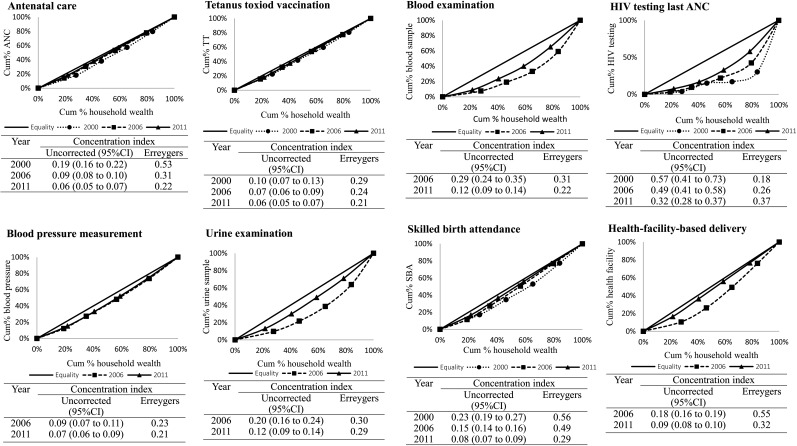
Figure 2.
Inequalities in utilization of reproductive health services by wealth status, Vietnam, 2000-2011. Cum%, cumulative percentage. Both uncorrected and Erreygers’ corrected concentration indices are shown. Positive values for the concentration index indicate increasing inequality favoring the rich, meaning that richer groups are utilizing services disproportionately more than poorer groups.

